
via 5 Unbeatable Types of Infographic + Free Tools to Create Them | Search Engine Journal.
An infographic (information graphic) has been a very effective way to bait for links and social media votes for ages. Like anything else, it can be done right or wrong (I am sure you have seen dozens of poorly implemented infographics by now and maybe a few really good ones). How to create a good one?
The secret is in days (maybe months) of brainstorming. A cool concept doesn’t even have to be too very well-designed. All you need is a great idea and some time of putting it together.
This post lists 5 unbeatable (when done right) types of infographics as well as free tools to help you put your ideas to life – enjoy!
1. Periodic Table

As the periodic table hangs in thousands of classrooms all over the world, it has become a visual metaphor and serves now as a template for knowledge presentation in various niches and verticals.
Examples:
Tools and resources:
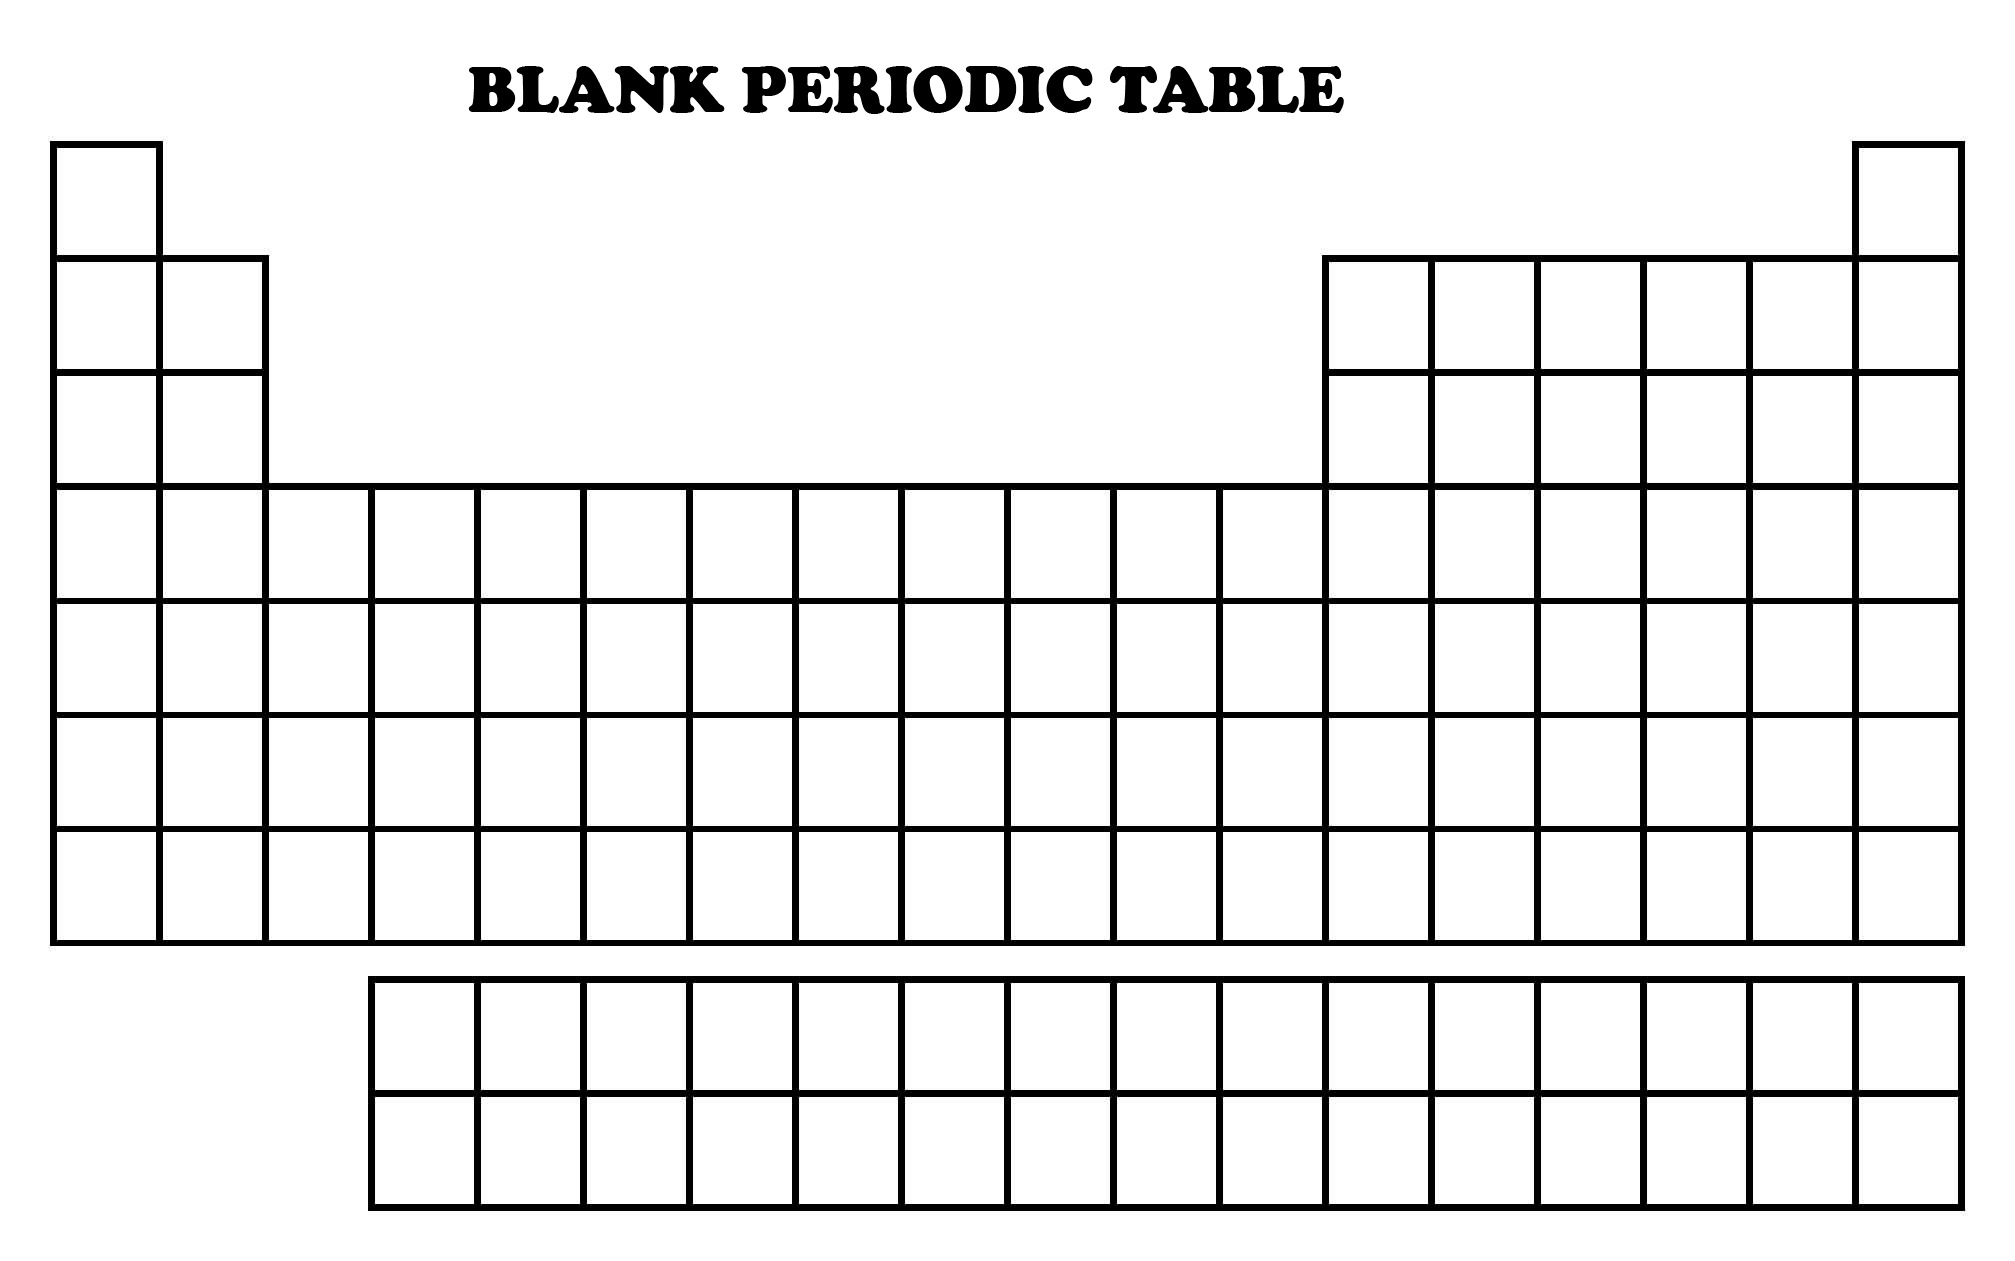
- Here’s a blank periodic table for you to fill out with any info you will be able to collect (quick tip for Photoshop dummies like myself: use the magic wand tool and click inside any cell to select the area inside it to edit it)
2. USA or World Map

A world map is another familiar visual image everyone knows from school – therefore using it to visualize some data related to our business is such a great way to effectively deliver your message and create well-recognizable associations.
Examples:
- xkcd: Online Communities
- World Map in Country Domain Mode
- Google Suggest USA Map (also mentioned by me in Google-Suggest viral projects post)
Tools and resources:
- GunnMap is a free online tool that allows you to paste in your own data to create a custom world map (video example of how it works)
- StatPlanet Map Maker is another awesome tool to get inspired and create nice interactive maps
- Download easy-to-edit images and edit them using your image editor:
- 3 Isolated 3D USA Maps (1474×720px) – the map consists of three layers – all representing the pretty USA map in different colors: USA flag, white (with state borders) and blue.
- Free Vector World Maps Collection: the huge collection of high-resolution world map images in various colors and textures.
3. Venn Diagram

A venn diagram is a diagram representing sets by intersecting circles and visualizing the relationships between the sets (overlapping circles show those features either unique or common to two or more concepts.). This visualization method requires almost no design skills – all you need is a hot clever concept that can be explained that way.
Examples:
- Social Media Venn Diagram
- “FINALLY: The Difference between Nerd, Dork, and Geek Explained by a Venn Diagram”
Tools and resources:
- Hohli is an easy-to-use free online application that lets you create venn diagrams in just a few seconds.
- Make Sweet is a fun free online tool that allows you to quickly create a neat-looking 3D venn diagram consisting of two circles. The best part of it is that you can also create fun image based venn diagrams for a more popular visual effect, for example:

4. Flow Chart

Flow charts are arguably the most engaging type of viral information graphic: when done right, they will prompt your visitors to stay for a few minutes to travel the flowchart trying different routes. These are the most complex in terms of designing (of all types reviewed here).
Examples:
- The Entrepreneur’s Visual Guide to Tech Startups
- Google(graphic) flowchart that visualizes what happens in the fraction of a second after 300 million people press the Search button every day.
- So You Want To Watch YouTube
Tools and resources:
- Creately (paid but cheap) is a neat online tool that allows to easily build flowcharts and invite your co-workers and friends to collaborate on them.
- Gliffy (free account comes with unlimited number of public diagrams) alows to create flow charts also with built-in collaboration support.
5. Typography Infographics

Typography infographic encompasses beautiful works of art, all designed and molded entirely from type – thus typography-based infographics can be used to feature play on words, typography illusions and other powerful and intriguing ways to deliver your message.
Examples:
- Type Map of Italy
- Red Tape: The Government Grind: US government average salaries and positions visualized
- The Giant Panda
Tools and resources:
